

Magma flow rate in the 2021 Fagradalsfjall eruption
The results of multiple surveys of lava flow rate with unprecedented accuracy and speed of delivery published in a paper in Geophysical Research Letters
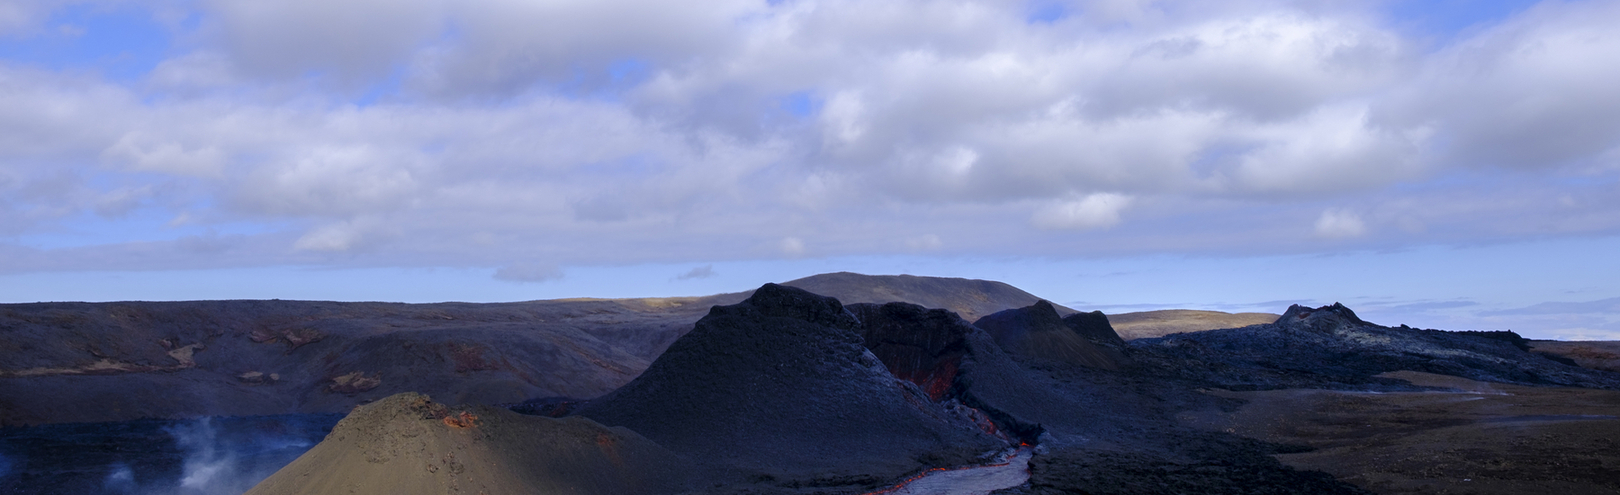
The eruption in Fagradalsfjall in 2021 marked the end of a period of almost eight centuries with no volcanic activity on the Reykjanes Peninsula. The eruption that started on the 3rd of August at a similar place on the peninsula confirms the onset of a new episode of activity. How frequent eruptions will be in the coming years or decades is not possible to predict, time will tell.
Lava-producing eruptions on the Reykjanes Peninsula occur close to population centers and important infrastructure. They therefore call for detailed monitoring. A new scientific paper published in Geophysical Research Letters presents the results of measurements and mapping of lava production and distribution in the 2021 eruption. The open access paper can be found here.
The work was carried out by a group of scientists at the Institute of Earth Sciences (IES, University of Iceland), the Icelandic Institute of Natural History (NI) and National Land Survey of Iceland (LMÍ) in collaboration with the Department of Civil Protection and Emergency Management at the National Commissioner of the Icelandic Police, and colleagues at various other institutions, both in Iceland and abroad.
Precise digital elevation models were compiled at regular intervals, partly from satellite data but mostly from aerial photography. Processing of the data was carried out in the hours after collection and the results usually presented on the same day. Lava production rate could be estimated from the changes in land elevation between surveys. The maps compiled and the associated data on lava production rate played a key role in assessing the eruption and estimating risks posed by the flowing lava. They were used by the authorities and scientists, as well as other people visiting the area. With this work a new step was taken in the monitoring of lava-producing eruptions, as this is the first time where it has been possible to map the lava fast enough to use the results as the principal basis for estimates of hazard and risk in near real time.
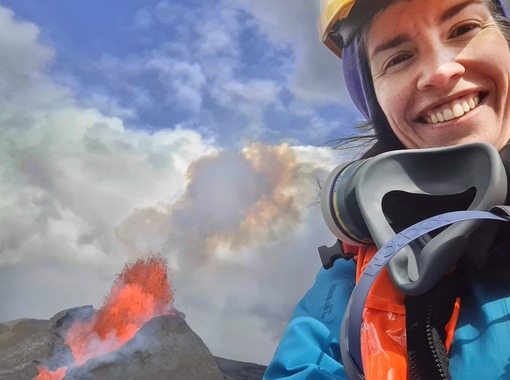
Gro Birkefeld Möller Pedersen, research scientist at IES, led the assessment of the evolving lava and the writing of the paper. Her research career has focused on using remote sensing data to gain a better understanding of how lava behaves, making it possible to respond faster and more effectively to the hazards of an effusive eruption.
Gro Birkefeld Möller Pedersen, research scientist at IES, led the assessment of the evolving lava and the writing of the paper. Birgir Vilhelm Óskarsson, geologist at the NI led the principal data gathering (vertical photogrammetry from aircraft) and Joaquin Belart, leader of remote sensing at the National Land Survey and a postdoctoral fellow at IES, processed the data and generated most of the maps. Many others played important roles and the total number of authors is 17. Preliminary results were made public at the web-page of the IES once processing was completed, while the final results are presented in the new paper.
This eruption was unusual. While long lasting, compared to other eruptions, the flow rate was low. It was highest around the middle of this six-month long eruption, about 12 m3/s, compared to 4-8 m3/s in the first 40 days. Most eruptions in Iceland are most powerful in the first hours or days. The explanation favored by the authors is that the excess pressure was small, and the flow rate controlled mainly by the width of the pipe feeding the eruption through the 15-20 km thick crust. This is usually not the case, as most eruptions occur when magma is released from a magma chamber in the crust. Then the flow channel is usually much shorter, and the flow rate controlled by the pressure in the magma chamber.
The methods developed in the eruption at Fagradalsfjall in 2021 are already being applied to the new eruption, see here.
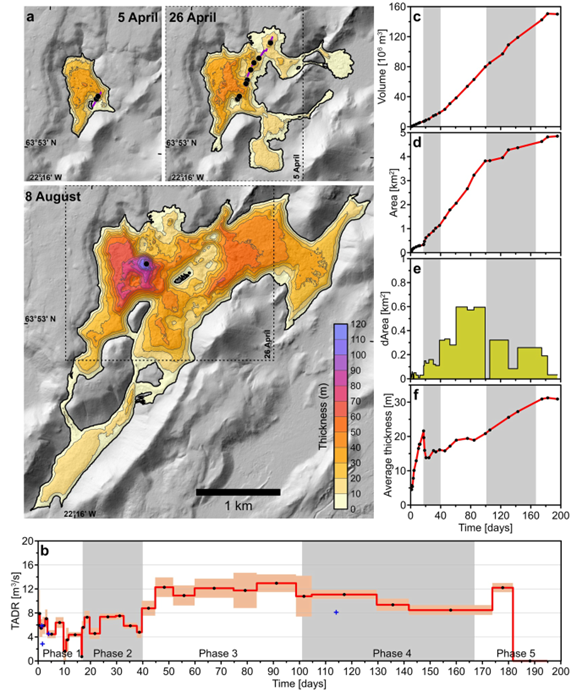
Fig. 2 in the article in Geophysical Research Letters shows how the lava evolved (a), lava flow rate with time (m3/s) (b), and changes in volume (c), area (d), rate of change (e) and average lava thickness.
