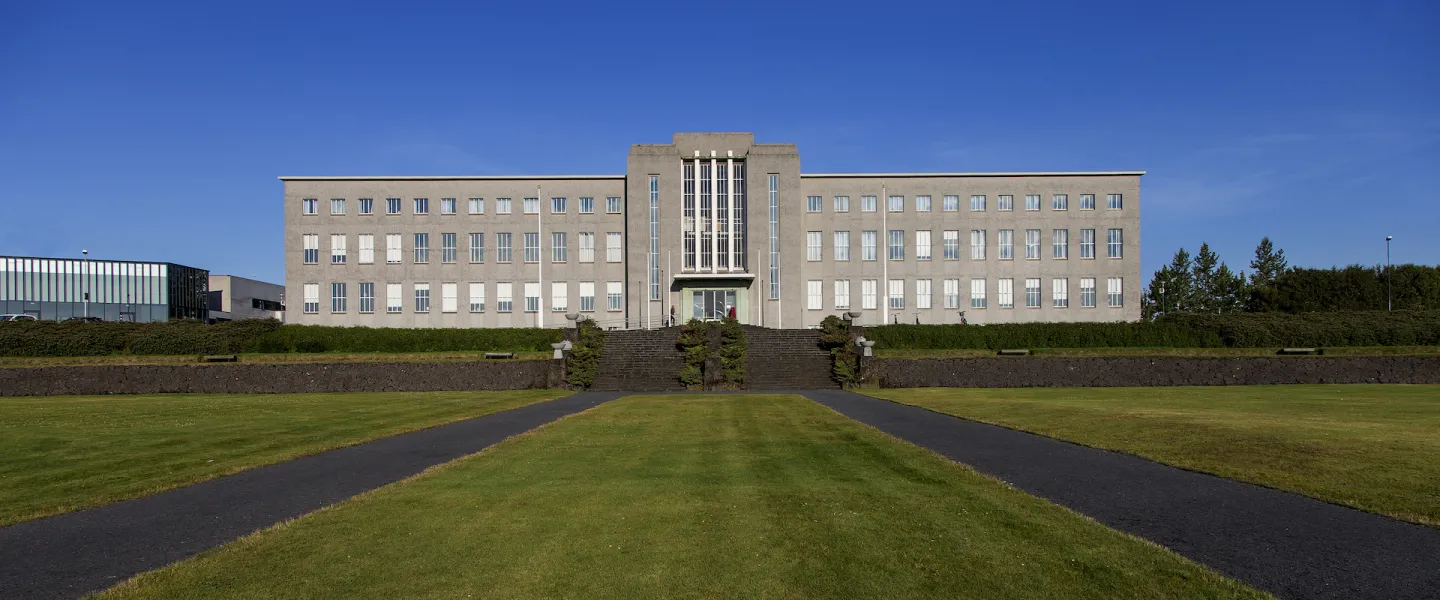
The University of Iceland is implementing what is known as the 'Green Steps' programme ('Græn skref' in Icelandic). According to the Icelandic Government's Climate Policy, all government institutions and offices are required to implement the Green Steps programme.
The Green Steps programme aims to reduce the negative environmental impacts of our operations and enhance environmental awareness among staff members. The project is run by the UI Sustainability Committee with the support of the rector.
The project focuses on promoting sustainable practices through systematic approaches. It has already brought numerous benefits and made operations at UI more sustainable and environmentally friendly, as well as reducing operating costs.
The Green Steps programme consists of five steps, each containing seven categories, designed to minimise negative environmental impacts. The categories are:
- Procurement
- Communication and management
- Meetings and events
- Waste reduction and recycling
- Electricity and heating
- Transportation
- Kitchen and cafeterias
Green Accounting is part of the Green Steps project. The University of Iceland has submitted Green Accounting reports since 2012 to the Environment Agency of Iceland.
The objective of Green Accounting is to gather information to assess procurement, consumption, waste generation and greenhouse gas emissions. The results from Green Accounting show what the University has achieved in making operations more sustainable, but also help establish realistic goals for improvement.
The Green Accounting system can be used in various ways, including:
- Collecting information on operational factors that cause negative environmental effects.
- Providing information on greenhouse gas emissions due to transportation, waste, and energy consumption.
- Highlighting areas for improvement in operations.
- Providing information to staff members and the public about the institution.
- Enhancing the institution's reputation in the community.
Green Accounting focuses on the following environmental factors that are considered to have the greatest impact in daily operations:
- Transportation
- Waste
- Energy consumption
- Paper usage
- Material consumption
2020 | 2021 | 2022 | |
---|---|---|---|
University buildings (m2) | 100,960 | 100,960 | 100,960 |
Employee full-time equivalent | 1,623 | 1,653 | 1,600 |
Students number | 15,370 | 13,719 | 11,970 |
Procurement | |||
Paper (kg) | 6,886 | 9,736 | 15,547 |
Cleaning services (certified) | 100% | 98% | 97% |
Resources | |||
Electricity (kWh) | 8,544,559 | 8,468,925 | 8,612,158 |
Emission (tCO2-e) | 83.7 | 88.9 | 88.7 |
Hot water (m3) | 406,785 | 372,332 | 409,265 |
Cold water (m3) | 148,242 | 164,069 | 166,365 |
Transportation | |||
Car fleet, petrol (l) | 14,088 | 17,104 | 22,111 |
Car fleet, distance (km) | 59,273 | 211,893 | 98,296 |
Emission trasportation (tCO2-e) | 51.5 | 94 | 71.4 |
Domestic flights (km) | 74,267 | 72,868 | 61,166 |
Emission (tCO2-e) | 15.6 | 15.0 | 11.4 |
International flights (km) | 1,024,693 | 941,706 | 5,708,522 |
Emission (tCO2-e) | 82 | 74.2 | 439.4 |
Transportation contracts | 219 | 190 | 63 |
Waste | |||
Recycled (kg) | 102,821 | 100,017 | 96,741 |
Landfill (kg) | 59,021 | 63,968 | 81,200 |
Recycling rate (%) | 63.50% | 63.50% | 54% |
Emission waste (tCO2-e) | 56.1 | 63.5 | 77.2 |
Total emission (tCO2-e) | 288.9 | 355.6 | 688.1 |